Fordham Pollen Index
Pollen Count | August 6–8
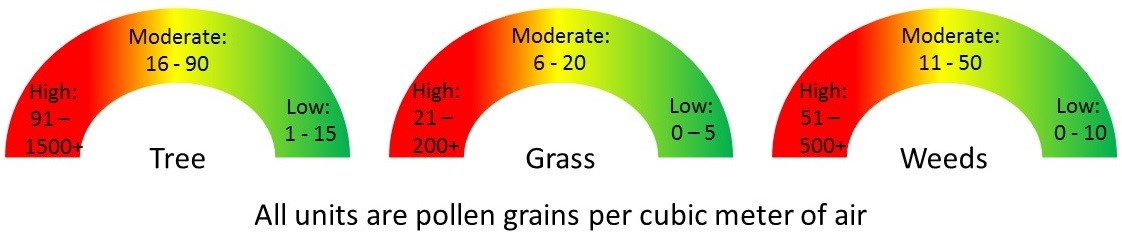
Armonk, N.Y.: Tree: 0 | Grass: 0 | Weeds: 0
New York, N.Y.: Tree: 0 | Grass: 0 | Weeds: 0
The Fordham Pollen Index is measured by collecting pollen from the air at our Lincoln Center campus in Midtown Manhattan and from our Louis Calder Biological Field Station in Armonk, NY.
Allergy season in the Northeastern United States runs from early March through late October. Trees, weeds and grasses release wind-blown pollen that is invisible but might give us a runny nose, itching and congestion. However, it can be more serious and some people get asthmatic symptoms. Trees produce the most pollen; they flower from spring into early summer. Then grasses and weeds begin to flower. Most grass and weed pollen is released from August through October. In early spring our pollen stations begin posting daily counts. For each day that you see a pollen count, you get the number of pollen grains that our air sampler collected over one 24-hour period, showing how many pollen grains we counted in each cubic meter of air. The count we give is followed by list of specific pollen types in their order of importance. Notice that the pollen count is not a forecast. The most recent count will be from the previous day. However, plant flowering times are quite predictable, and if you follow the counts over a few days, you can see which pollen types are on the rise. So if you have allergies and you know what you are allergic to, this might be a good time to see your doctor.
Pollen Fact of the Week
Fordham’s Pollen Monitoring Station at the Louis Calder Center will be 20 years old in 2017 (and the Louis Calder Center will be 50 years old!). Time flies when you’re counting pollen!
View the pollen count spreadsheet.
For further information, contact Dr. Guy Robinson.