Charles Scheland's Project
Assessing Pink-Tax Variations and Price Discrimination
Abstract
This paper defines and explains the gender-based practice of price discrimination called the “pink-tax.†It goes into depth on the origins and justifications of this practice and explains how this form of differentiated pricing continues to persist, especially in the personal care product market. It then postulates that the pink-tax might operate in conjunction with a tax on poorer neighborhoods: since there is noticeable gendered price discrimination, is it possible that price discrimination might also be implemented against lower income consumers, based on location? If this hypothesis were true, it would be a doubly regressive tax on poor women. Based on past scholarship, preliminary research, and urban planning data, various New York City neighborhoods were chosen and multiple drug stores in those neighborhoods were visited using the price of disposable razors as a good for study. Various attributes of these goods were recorded into a panel of characteristic data, and per blade price for equivalent male and female products were compared. This price differential represents the pink-tax, and while no substantial evidence of the pink-tax was found at CVS or Walgreens stores, Rite-Aid did display the clear trend of higher prices for female goods. Following that initial analysis, the correlation between income and price differential was tested and the correlation was a weak positive correlation, suggesting that actually wealthier neighborhoods were subject to more aggressive pink-tax discrimination. Some extension topics as well as methodological shortcomings were also addressed.
Introduction
Women face explicit economic disadvantages in the 21stcentury and even in the developed world, including the United States of America. Pay inequity in the USA shows women traditionally earn about 80% of what an equally qualified male employee earns (Maloney, 2016). This difference is called the “gender pay gap.” There are other examples of economic inequality between the sexes. As ubiquitous as the pay gap, is the so-called “pink-tax,” or the differentiated pricing on goods marketed towards women though essentially identical to their male or non-gendered counterpart. A product made “for a woman”, such as a stick of deodorant might contain the same ingredients, be of the same volume, and be produced by the same brand as a stick of deodorant “for men,” but be marketed in feminine packaging and cost more money per unit volume. Generally, this marketing involves the color pink, or something else based in the antiquated object of women as the softer sex, and thus “this markup has become known as the ‘pink-tax.’” (Maloney, 2016)
Pink-Tax as an Intersectional Issue
The pink-tax is a pervasive problem which crosses multiple product markets. Traditionally, it is probably most commonly mentioned among the personal care goods markets, but it goes across in to service industry (haircuts), healthcare (over the counter pills), and even office supplies (pens) (NPR, 2018). That is not an exhaustive list, simply three further examples beyond the personal care products. “Across industry categories, women’s products [a]re consistently priced higher…. Overall, women’s products [a]re priced an average of 7 percent higher than substantially similar men’s products.The difference in average prices [is] smallest for children’s clothing (4 percent), and largest for personal care products such as deodorants, body wash and razors (13 percent) (Maloney, 2016).
The nexus question of this research concerns whether or not the pink-tax operates in conjunction with an additional tax imposed on poorer neighborhoods. If we can find substantial evidence that price discrimination has been employed to the detriment of women, is it too far of a leap to wonder if it has been to the disadvantage of people of color or against people of different socio-economic classes?
The definition of a regressive tax is“a tax applied uniformly, taking a larger percentage of income from low-income earners than from high-income earners” (Kagan, 2019). Therefore, any tax which charges the same dollar amount to all consumers is regressive. The pink-tax fits this definition because higher-income and lower-income consumers absorb that same extra dollar amount applied to “female products,” but this constitutes a larger percentage of discretionary income for lower-income consumers. Since the pink-tax is intrinsically regressive, could it be that that price differential also is increased further in poorer neighborhoods? If this is the case, then the intersection of a pink and a tax on poor neighborhoods could disproportionately harm a particularly vulnerable group.
Hypothesis
The pink-tax however intentioned exploits and exacerbates other forms of sexism. The hypothesis of this research is that price discrimination follows not only the pink-tax, but also a tax on poor neighborhoods and that the price differentials between male and female hygiene products is different across different socio-economic neighborhoods. Assuming that poorer neighborhoods face even marginally higher pink-tax price differentials than wealthier neighborhoods, this would be an additional regressive tax on poor women because the pink-tax is already regressive, and even slightly higher values of the pink-tax on lower-income areas would absorb a larger proportion of discretionary income.
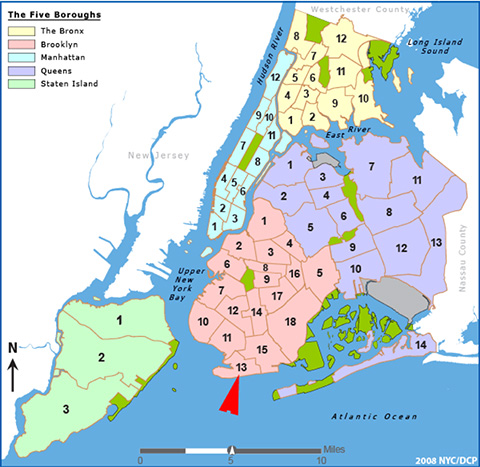
Store Selection
Three stores per CD were surveyed, one from each major chain: CVS, Rite-Aid, and Walgreens. These chains were identified (Miller, 2013) as having shown price discrimination based on location in other research and their retail stores are can be found across New York City. In some neighborhoods a Duane Reade replaced a Walgreens, but since Walgreens owns Duane Reade, their selections are treated in this study as interchangeable, and hereafter, Walgreens will be used to refer to both Walgreens and Duane Reade store locations.
While there are other chain stores that have locations in New York City, none have stores across all five of the boroughs.
Good Selection
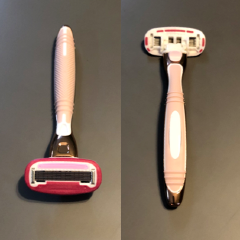
Disposable razors were chosen as the product for study. The rationale for this decision is as follows.
- Three major brands dominate the market and produce the male and female goods: Gilette, Schick, and Bic (as well as a store brand for each chain store)
- The quantity of each good is easily measurable: number of razors in pack and number of blades per razor
- The male and female goods are very similar. The same blades which men use can be used by women to the same effect. The blades themselves are not intrinsically different for men and for women.
There is one caveat to that third point, which is that more frequently with women’s razors, there will be some padding or soap bar around the blades of the razor. Some male razors also have that padding, but it is more frequently found in women’s razors. In the discussion of the data table, there will be an explanation as to how the padding was addressed in comparing prices.
Selected CDs
|
|
Manhattan |
Bronx |
Brooklyn |
Staten Island |
Queens |
|
Wealthiest |
8 |
10 |
6 |
3 |
11 |
|
Middle |
4/5 |
9 |
5 |
|
9 |
|
Poorest |
12 |
5 |
7 |
1 |
4 |
Quantity Demanded Score
|
|
CVS |
Rite-Aid |
Walgreens |
|
Manhattan 8 |
1 |
2 |
1 |
|
Manhattan 4/5 |
1 |
2 |
1 |
|
Manhattan 12 |
1 |
3 |
2 |
|
Bronx 10 |
1 |
2 |
1 |
|
Bronx 9 |
2 |
3 |
3 |
|
Bronx 5 |
2 |
4 |
4 |
|
Brooklyn 6 |
1 |
2 |
2 |
|
Brooklyn 5 |
1 |
4 |
2 |
|
Brooklyn 7 |
2 |
4 |
3 |
|
Staten Island 3 |
2 |
3 |
3 |
|
Staten Island 1 |
2 |
4 |
4 |
|
Queens 11 |
1 |
3 |
1 |
|
Queens 9 |
2 |
4 |
3 |
|
Queens 4 |
2 |
4 |
4 |
|
Online |
N/A |
N/A |
N/A |
Results
The data set below shows the average difference between equivalent female and male razors in the measurement of blades per razor, in which extra padding is valued the same as one additional blade. The appendix shows the entire collected data set for each CD, with entries organized first by blade count then by store, brand, and male/female. The sheets also include the metric of price per blade and price per blade plus padding (padding being incorporated as blades+1). The final columns show the difference between the price per blade cost for female razors to male razors. This table was derived from averaging all of the differences for which there was an appropriate male/female equivalent good available at that store. The 3rdthrough 5thcolumns feature the average difference within each specific store.
|
|
Price difference ($) |
Average Tax on Women at CVS ($) |
Average Tax on Women at Rite-Aid ($) |
Average Tax on Women at Walgreens ($) |
|
Bronx 10 |
|
|
|
|
|
Bronx 5 |
|
|
|
|
|
Bronx 9 |
|
|
|
|
|
Brooklyn 5 |
|
|
|
|
|
Brooklyn 6 |
|
|
|
|
|
Brooklyn 7 |
|
|
|
|
|
Manhattan 12 |
|
|
|
|
|
Manhattan 4 |
|
|
|
|
|
Manhattan 8 |
|
|
|
|
|
Queens 11 |
|
|
|
|
|
Queens 4 |
|
|
|
|
|
Queens 9 |
|
|
|
|
|
Staten Island 1 |
|
|
|
|
|
Staten Island 3 |
|
|
|
|
|
|
|
|
|
|
|
Standard Error |
|
|
|
|
These sample data actually suggest an inverse pink-tax. Each negative value is a store in which the male product was, on average, priced relatively higher than the female equivalent. This is in direct conflict with past scholarship on the pink-tax. One noteworthy exception is that the Rite-Aid stores displayed a positive pink-tax in more CDs than they did not. The standard error is included in the bottom of the table.
Pearson Correlation: Pink-Tax with Tax on Poor Neighborhoods
In order from wealthiest to least wealthy (Census, 2019 and NPR, 2018):
- Manhattan 8 ~ $110,000
- Brooklyn 6 ~ $105,000
- Staten Island 3 ~ $90,000
- Queens 11 ~ $80,000
- Manhattan 4 ~ $75,000
- Staten Island 1 ~ $75,000
- Bronx 10 ~ $60,000
- Queens 9 ~ $60,000
- Queens 4 ~ $45,000
- Brooklyn 5 ~ $40,000
- Brooklyn 7 ~ $35,000
- Manhattan 12 ~ $35,000
- Bronx 9 ~ $30,000
- Bronx 5 ~ $25,000
This list ranks in loose approximation the average income of all of the CDs surveyed by using the US Census Bureau public report. The initial goal of this research was to determine if the pink-tax correlated to average income and standard of living. The hypothesis is that a higher pink-tax margin might exist in poorer neighborhoods and because of the lower average income that this intersection would be a regressive wealth-tax. These average incomes were ultimately tested using the Pearson Correlation Test against Average Price differential in their neighborhood. The Pearson Correlation Test is a statistical tool used to assess the relationship between two values based on an entire data set. For this test, average income was measured in relation to average price difference (male minus female). The higher the value of coefficient result from the Pearson test, the stronger the relationship between the two variables is. The value can be anywhere between -1 (meaning an inverse relationship) and +1 (meaning a positive relationship, with 0 meaning no relationship). The results are displayed below.
|
CD |
Average Income |
Average Price Difference (Male-Female) |
|
Manhattan 8 |
110000 |
0.0849 |
|
Brooklyn 6 |
105000 |
0.152 |
|
Staten Island 3 |
90000 |
-0.0082 |
|
Queens 11 |
80000 |
-0.1932 |
|
Manhattan 4 |
75000 |
-0.2 |
|
Staten Island 1 |
75000 |
-0.062 |
|
Bronx 10 |
60000 |
0.022 |
|
Queens 9 |
60000 |
0.0119 |
|
Queens 4 |
45000 |
-0.1508 |
|
Brooklyn 5 |
40000 |
-0.0147 |
|
Brooklyn 7 |
35000 |
-0.0309 |
|
Manhattan 12 |
35000 |
-0.0231 |
|
Bronx 9 |
30000 |
-0.0994 |
|
Bronx 5 |
25000 |
-0.0482 |
|
Pearson Correlation Test |
|
|
coefficient (r) |
0.350864806 |
|
n |
14 |
|
t statistic |
1.297946851 |
|
degrees of freedom |
12 |
|
p-value |
0.218699398 |
The correlation between average income and average price difference is 0.35 positive within the sample, but does not indicate a particularly strong relationship between the two values. The hypothesis that pink-tax values would increase in poorer neighborhoods is not supported by the in-sample correlation. This r value suggests that male products did become slightly more expensive in wealthier neighborhoods, but that around 65% of those price changes probably had nothing to do with the changing level of income. That being said, the p-value is too large to statistically reject the absence of a relationship between these two variables.
Impossibility of Demand
One of the largest limitations of this study is the role of demand in price-setting. Any presumption of the pink-tax assumes some active role in the market by producers to change prices. If the market were completely free, theoretically the pink-tax would cease to exist because no one would be willing to purchase a higher priced female product. We must, therefore, accept that there is some interference in the price-setting. However, price and quantity sold are co-determined by the intersection of supply and of demand. The data set postulates price without quantity, but in an ideal world, quantity sold would also be measured.
Capturing quantity sold was logistically it is infeasible for the researcher. Instead, each store was assigned a “Quantity Demanded Score.” This was a subjective and discrete score assigned based on the general level of stocked products on the rack. If the disposable razor section was almost or completely stocked, the store received a 1, if mostly stocked a 2, if more empty than full a 3, and if almost or completely empty a 4. 4 being the largest number and suggesting the highest level of quantity demanded.
The full table can be found in the appendix. The researcher did not incorporate the demand score into the analysis because it is difficult to draw conclusions form small samples presumed to be weak correlates to quantity sold. If the researcher visited a store the day after or before restocking, those same scores might be entirely different.
However, this is some slight indication of a trend. Poorer neighborhoods appear to be more frequently lower on stock and Rite-Aid tended to be lower on stock than the other two chains. These differences could be attributed to many different causes, not least of which might be that wealthier people buy reusable razors because they are able to absorb the initially higher cost of reusable razors.
Imperfect Data Set
Some limitations of this study included the imperfect nature of the data set and product equivalency. In collecting the data, clearly not all stores had the same products. If every single store visited had the same products, the final data sheet would have been even more comprehensive.
This study is also limited by the fact that is a survey of only one product. Disposable razors are only one good of many which face discriminatory pricing practices. This research methodology could be applied to any number of other products.
One final caveat is the equivalency of razors with padding and those without. As mentioned, the only true essential difference between some razors is that some, primarily women’s, have extra passing around the blade. In future research, it would be valuable to find a better way of including that in scoring and price analysis. This research valued the padding as the cost and benefit of one extra blade (NPR, 2018). There is discussion as to whether or not the padding is even helpful or if it actually creates a less effective shave, requiring women to shave more frequently and thus buy shaving materials more often. A survey or further scholarship ought to be conducted in the future to determine other ways of incorporating that one essential difference into the calculations.
Conclusion
These data do not wholly support the existence of a pink-tax. At most, Rite-Aid charged higher prices for female goods than the equivalent male razor more often than not, but the data set, by and large, does not provide evidence to support existence of a pink-tax on razors in New York City. The data do not indicate any intersection of a tax on poor neighborhoods with the pink-tax. There may be insufficient statistical power of the data to test this hypothesis. Perhaps this is evidence that consumers ignore the segmented market. If one observes unnecessary gendered pricing, an easy solution is to simply buy the less expensive product even if that is the “incorrect gender.” By choosing to by the less expensive “male” product, one can defy the segmentation in the market for male versus female goods.

The gendered price differentials in the data seem entirely random and uncorrelated to the relative wealth of the CD they were located in. This is of course, a good thing in a moral sense. The pink-tax is a heinous vestige of misogyny so to discover that it is not paired with a tax on poor neighborhoods, while disappointing in terms of academic scholarship and discovery, is good for general social welfare. Also, while these sample data are inconclusive, they also do not prove an absence of a pink-tax. Since this sample is inconclusive, there is still the real possibility of active pink-tax price discrimination.
A possible extension of this work is that of complementary and substitute goods. Shaving can be done with the aid of other equipment (complements) or with reusable razors (a substitute to disposable ones). Future scholarship could try to capture the economic impact of these goods on the pricing.
Additionally, there are other areas of gendered discrimination beyond the explicit pink-tax which figure into any analysis of standard of living, such as the gender pay gap, and the pricing of female hygiene products which are essential to life. Tampons, pads, and other menstrual products are only consumed by women with relatively inelastic demand because women need them regularly and for everyday use. The fact that these goods even cost something at all is effectively a tax on womanhood.
References
Amoros, R. (2019, April 9). Visualizing the Pink Tax - The Cost of Being a Woman. Retrieved July 10, 2019, from https://howmuch.net/articles/pink-tax-which-products-are-more-expensive-for-women-than-men
Ashford, K. (2019, February 8). What Is the Pink Tax? (And Are You Paying It?). Retrieved August 10, 2019, from https://www.valuepenguin.com/personal-finance/pink-tax
Elliott, C. (2019, September 8). The Pink Tax- The Cost of Being a Female Consumer. Retrieved June 7, 2019, from https://www.listenmoneymatters.com/the-pink-tax/
History. (2019). Retrieved July 1, 2019, from https://cvshealth.com/about/company-history
Jacobsen, K. (2018). Rolling Back the “Pink Tax”: Dim Prospects for Eliminating Gender-Based Price Discrimination in the Sale of Consumer Goods and Services. California Western Law Review, 54(2). Retrieved from https://scholarlycommons.law.cwsl.edu/cgi/viewcontent.cgi?article=1652&context=cwlr
Kagan, J. (2019, March 26). Regressive Tax. Retrieved October 10, 2019, from https://www.investopedia.com/terms/r/regressivetax.asp
Levitz, E. (2015, October 27). Soon New Yorkers May No Longer Have to Choose Between Rite Aid and Duane Reade. Retrieved January 29, 2019, from http://nymag.com/intelligencer/2015/10/rite-aid-and-duane-reade-to-merge.html
Maps & Geography. (2019). Retrieved June 10, 2019, from https://www1.nyc.gov/site/planning/data-maps/city-neighborhoods.page
Miller, T. (2013, September 5). Walgreens shoppers dinged by price variations more than Rite Aid and CVS customers, consumer groups find. Retrieved February 11, 2019, from https://www.nydailynews.com/life-style/health/walgreens-shoppers-dinged-price-variations-rite-aid-cvs-article-1.1446937
New York City Department of Consumer Affairs. (2015). From Cradle to Cane: The Cost of Being a Female Consumer. Retrieved from https://www1.nyc.gov/assets/dca/downloads/pdf/partners/Study-of-Gender-Pricing-in-NYC.pdf
NYC Community District Profiles. (2019). Retrieved July 7, 2019, from https://communityprofiles.planning.nyc.gov/manhattan/1#resources
Oliver, A. (2014, December 12). Ever Heard of the “Pink Tax”? 4 Items Women Pay More For. Retrieved December 19, 2019, from https://groundswell.org/ever-heard-of-the-pink-tax-4-items-women-pay-more-for/
Our Story. (2019). Retrieved July 1, 2019, from https://www.riteaid.com/about-us/our-story
Palmer, E. (2019, June 10). What Is the “Pink Tax?” New York Lawmakers Could Soon End Discriminatory Pricing of Women’s Products. Retrieved July 10, 2019, from https://www.newsweek.com/new-york-pink-tax-pricing-women-products-1443149
Tuttle, B (2016, June 9). 12 Products Marketed to One Gender for No Good Reason. Retrieved February 12, 2019, from http://money.com/money/4360406/gender-marketing-products-pen-laundry-yogurt/
Twin, A. (2019, June 25). Price Discrimination. Retrieved October 12, 2019, from https://www.investopedia.com/terms/p/price_discrimination.asp
US Census Bureau Laura K Yax CNMP. (2013). Census Explorer. Retrieved July 7, 2019, from https://www.census.gov/censusexplorer/censusexplorer.html
U.S.Cong., Joint Economic Committee. (n.d.). The Pink Tax: How Gender-Based Pricing Hurts Women’s Buying Power(C. Maloney, Author) [Cong. Rept. from 114thCong., 2nd sess.].
Vanek Smith, S., & Duffin, K. (2018, November 13). The Program with the Pink Tax. Retrieved June 7, 2019, from https://choice.npr.org/index.html?origin=https://www.npr.org/sections/money/2018/11/13/667539767/the-problem-with-the-pink-tax
Walden University. (2019). Academic Guides: Other APA Guidelines: Appendices. Retrieved December 19, 2019, from https://academicguides.waldenu.edu/writingcenter/apa/other/appendices
Walgreens Historical Highlights. (2019). Retrieved July 1, 2019, from https://www.walgreens.com/topic/press/facts.jsp
Wade, L (2015, January 27). 5 Reasons Why Pointlessly Gendered Products are a Problem. Retrieved February 12, 2019, from https://psmag.com/social-justice/reasons-why-pointlessly-gendered-products-are-a-problem