Brandon Roy's Project
Sentiment Analysis on Tweets Using Machine Learning and Combinatorial Fusion
Dominik Ondusko, James Ho, Brandon Roy, and D. Frank Hsu
Laboratory of Informatics and Data Mining, Department of Computer and Information Sciences
Fordham University
Challenge and Approach
Challenge: Twitter contains a large amount of unstructured and imbalanced data. This provides a challenge when performing sentiment analysis on this data.
Approach: First we deal with the imbalanced dataset issue by using the synthetic minority over-sampling algorithm (SMOTE) to synthetically oversample the minority class. Next, we implement different n-gram vectorizations and term frequency-inverse document frequency vectorizations on the dataset. Then we take a two-stage ACCESS pipeline approach as used in the Combinatorial Fusion Analysis (CFA) framework (Figure 2, [6]). Stage one involves using our machine learning algorithms to select and combine extracted attributes from our dataset. Stage two is where a subset of good and diverse algorithms is combined through the process of CFA. It must be noted that the algorithms being combined must be diverse in the sense of cognitive diversity. This means that the algorithms must think differently from each other or else there will not be as much improvement through CFA.
Methods of Classification
Logistic Regression: This algorithm outputs pseudo probabilistic values. In a binary situation, they should be mean 0 or 1. This can be extended to multi-class. The key assumption is that all encounters are believed to be independent.
Naive Bayes: This algorithm is a probability-based classifier that uses Bayes theorem and estimates the maximum a posterior using a feature independence assumption.
Perceptron: Given a feature X, Perceptron will give a label for 1 and -1. Perceptron acts as a linear binary classifier, with the 1 acting as a threshold. If X does not meet this threshold, it is -1.
Random Forest: This algorithm is an ensemble of many decision trees. The decision trees are built using an entropy value. This entropy value is a measure of the purity of the node. The power in a random forest is that the variance amongst decision trees improve the classification performance.
Support Vector Machine (SVM): This algorithm is similar to Perceptron but uses a hyperplane to determine a threshold to choose class labels. The margins of the function are maximized by using multiple hyperplanes and optimal points for support. Non-linear formulations of SVM exist such as Radial Basis Function (RBF) which attempts to draw nonlinear boundaries.
Combinatorial Fusion Analysis
For each vectorization method, a set of scoring systems S is generated:
S = {A1,A2,A3, ... , An}
Each Ai is a classification model. In our case n = 5 and each scoring system will have 3 classes: positive, negative, and neutral.
For each tweet, each scoring system A assigns a confidence score to the tweet according to the three classes PA (positive), PA (neutral), and PA (negative) which sum up to 1. This scoring process is applied to every tweet that will be classified.
Once a score function SA of the scoring system A for each of the three classes is established, rank function rA of A can be constructed by sorting the score values in descending order [5, 6, 7]. With the constructed score function SA and rank function rA, the Rank-Score Characteristic (RSC) function can be computed as:
ƒA(i) = SA-1(rA(i))
For two scoring systems A and B, Cognitive diversity, between A and B is defined as:
ƒA(i) = SA-1(rA(i))
For two scoring systems A and B, Cognitive diversity, between A and B is defined as:
d(A,B) = d(ƒA,ƒB) = ✓Σ[ƒB(i)]2 (6)
where i = 1, 2, …, 14.5k.
Results
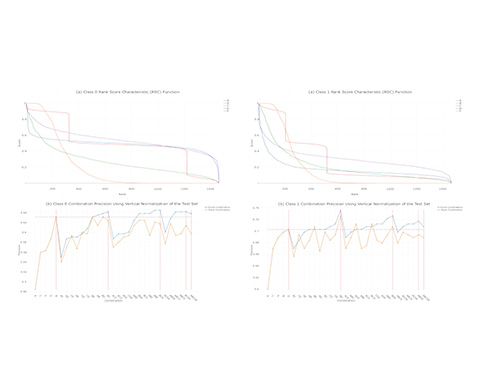
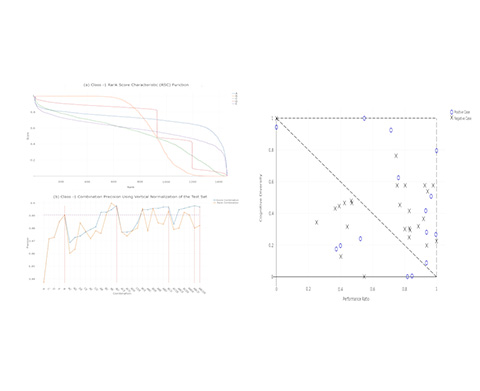
Figures 1, 2, and 3 show the RSC function and combination precisions for each class (-1 for negative, 0 for neutral, 1 for positive) respectively. The three figures, part (a) is the rank-score characteristic function graph for our 5 methods of classification. Part (b) shows the precision all 26 (25-1-5) combinations. Blue represents score combinations and blue represents rank combinations. For all groups in (b), precision has been ordered with respect to score combinations.
Figures 1, 2, 3 demonstrate that certain combinations of all 5 of the methods of classification, or the combination of all 5 methods can out-perform the best performances of the individual algorithms. So long as the individual classification methods are cognitively diverse, the combination of them can perform better than individual algorithms.
Figure 4 illustrates the results of our 60 2-combinations with the 5 methods of classifications and the 3 classes. Score combination and rank combination each have 30 points. The x coordinate is the performance ratio and the y coordinate is the cognitive diversity value. Both values are normalized using standard scalar linear function to [0, 1].
Conclusions
Combining cognitively diverse and accurate models can improve performance compared to individual models alone. Figure 4 specifically shows that combination of two algorithms can out-perform individual algorithms (positive cases) given they have high performance ration and cognitive diversity.
Future work will contain weighted combinations using performance or model diversity of each model as a weight. Also other classification algorithms can be used such as neural networks. Other sampling methods can also be used instead of SMOTE, such as under sampling or oversampling the majority class.
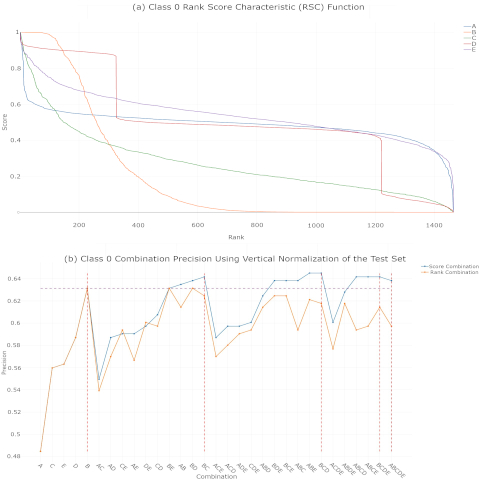
Figure 1. Class 0 RSC function and combination performance
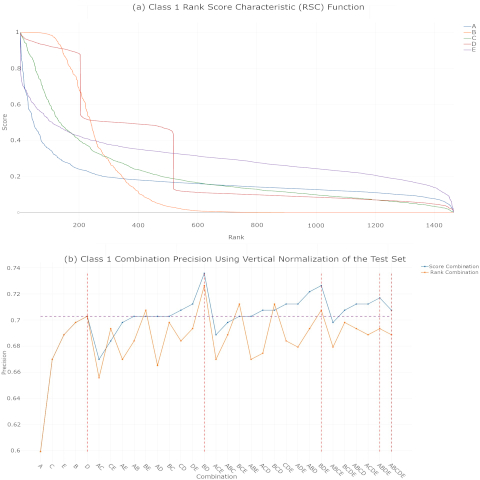
Figure 2. Class 1 RSC function and combination performance
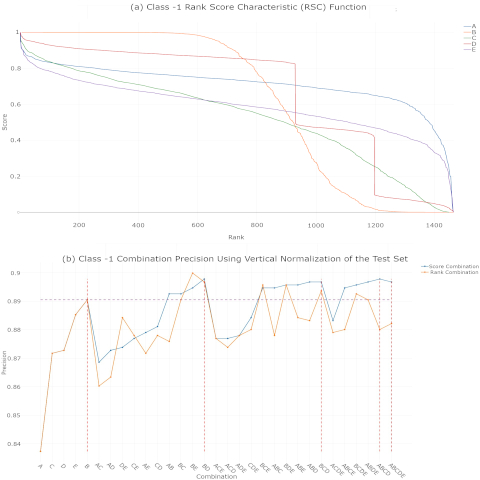
Figure 3. Class -1 RSC function and combination performance
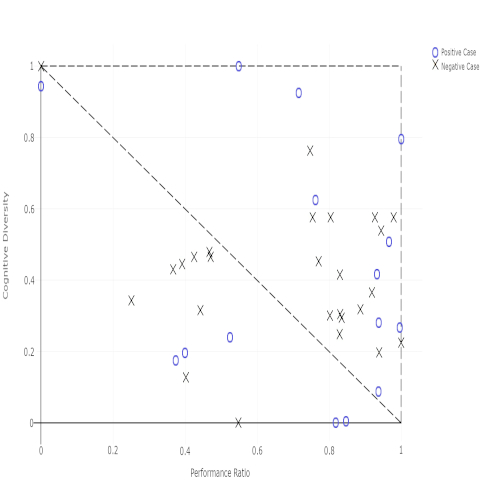
Figure 4. Combination of 2 Algorithms: Positive Cases (o) and Negative Cases (x)
References
[1] C. M. Bishop, Pattern Recognition and Machine Learning, vol. 4, Springer, 2006.
[2] N. F. F. da Silva, E. R. Hruschka, and E. R. Hruschka. Jr., “Tweet Sentiment Analysis with Classifier Ensembles.,” In Decision Support Systems, vol. 66, 2014, pp. 170–179.